Quick answer
An unshaded south roof at 35° in Winsford makes about 954 kWh a year for each kWp; the best in our runs, south at 40°, makes 957. East and west roofs make about 80% and 79% of that, north about 54%. May to July brings 355 kWh per kWp; November to January 101.
By direction and pitch
Figures are a year’s output from 1 kWp at 53.191° N, 2.524° W, from PVGIS 5.3.
| Facing | 10° | 20° | 30° | 35° | 40° | 45° | 50° |
|---|---|---|---|---|---|---|---|
| South | 865 | 916 | 947 | 954 | 957 | 954 | 946 |
| South-east | 845 | 879 | 898 | 901 | 900 | 894 | 883 |
| South-west | 843 | 876 | 893 | 896 | 894 | 888 | 877 |
| East | 793 | 784 | 771 | 761 | 749 | 734 | 717 |
| West | 790 | 780 | 765 | 755 | 742 | 727 | 710 |
| North-east | 738 | 679 | 623 | 596 | 570 | 544 | 518 |
| North-west | 736 | 676 | 620 | 594 | 568 | 542 | 516 |
| North | 714 | 636 | 558 | 519 | 481 | 444 | 408 |
By system size
| Size | South | South-west | West | East |
|---|---|---|---|---|
| 2 kWp | 1,909 | 1,792 | 1,509 | 1,521 |
| 3 kWp | 2,863 | 2,689 | 2,264 | 2,282 |
| 4 kWp | 3,817 | 3,585 | 3,018 | 3,042 |
| 5 kWp | 4,772 | 4,481 | 3,773 | 3,803 |
| 6 kWp | 5,726 | 5,377 | 4,527 | 4,564 |
Many Winsford homes are semis and terraces, where one roof face often points east or west. Two faces of 2 kWp each, east and west, make roughly as much as 3.2 kWp facing south, spread across the morning and evening. Semi-detached homes looks at the choice.
Through the year
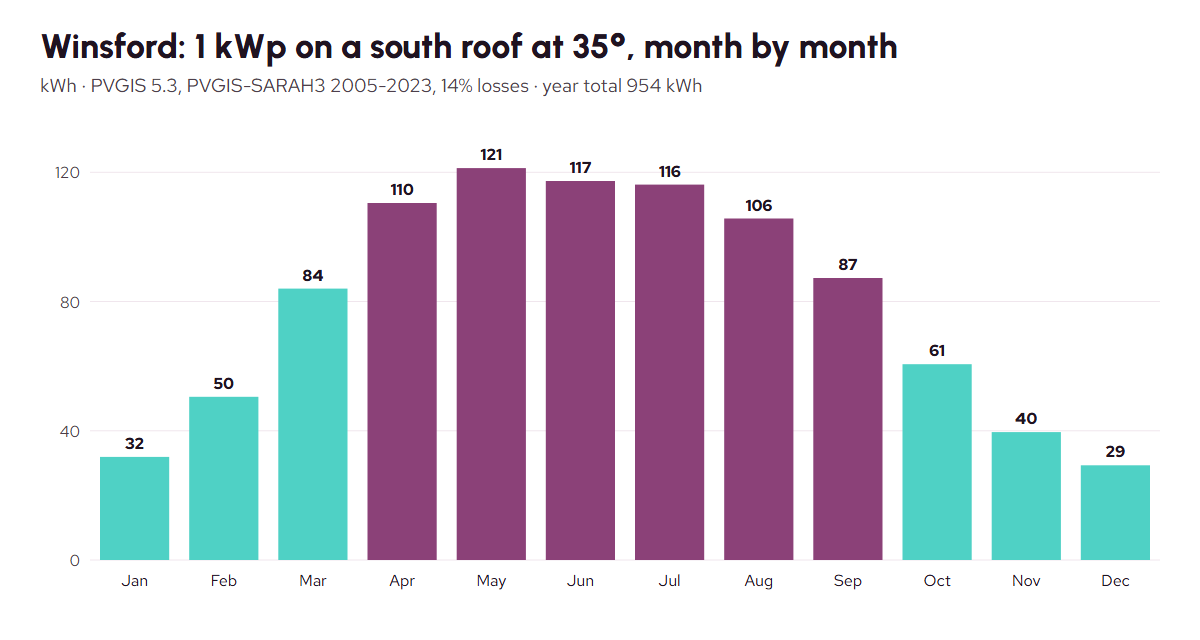
| Jan | Feb | Mar | Apr | May | Jun | Jul | Aug | Sep | Oct | Nov | Dec |
|---|---|---|---|---|---|---|---|---|---|---|---|
| 32 | 51 | 84 | 111 | 121 | 117 | 116 | 106 | 87 | 61 | 40 | 29 |
Summer output is several times winter output, which is why what the household does with summer surplus matters: export and self-use and batteries.
How the model reaches 954 kWh
It starts with sunlight. Averaged over 2005-2023, a surface tilted at 35° and facing due south in Winsford receives about 1,178 kWh of solar energy per square metre a year. A 1 kWp array is rated in full sun of one kilowatt per square metre, so a perfect one would turn that into 1,178 kWh. Real panels fall short, and PVGIS takes the shortfall off in steps (PVGIS 5.3):
- Light reaching the glass at a shallow angle is partly reflected, which costs 3.2%.
- Warm cells and dim days work less well, which costs 4.3%.
- The colour of daylight here suits the cells slightly, which gives back 1.7%.
- Cables, the inverter and dirt take the 14% allowance used in every run on this site.
Together those remove about 19.0%, which is how 1 kWp ends up at 954 kWh a year.
A good year and a poor one
That figure is an average. PVGIS puts the year-to-year variation for this roof at about 28 kWh per kWp (one standard deviation), so a 4 kWp array that makes 3,817 kWh in a typical year could come in 113 kWh higher or lower without any fault. Single months move more. July varies by about 16 kWh per kWp from one year to the next and December by about 6, so a dull summer can make a new system look weak for a few weeks. Judge it over twelve months, from the generation meter rather than the bill.
Pitch, and why it rarely decides anything
For a south roof in Winsford, the model’s own best pitch is 40°, which makes 957 kWh per kWp, only 2 more than at 35°. Very shallow roofs are where pitch starts to matter: at 10° the same south roof makes 91% of its 35° output. Terrain makes no difference here: with the PVGIS horizon switched off, the model gives the same figure. If a quote states a pitch, ask whether someone measured it on the roof or read it off a photo.
A December day and a June day
Monthly totals hide how uneven the days are. Spread over the month, a 4 kWp south roof in Winsford averages about 3.8 kWh a day in December and 15.6 kWh a day in June. The December figure is small enough that a household at home in the day can use most of it as it is made. The June figure is far more than most homes use in daylight, which is where an export tariff or a battery comes in.
Shallow north slopes
North is not always a lost cause. A north slope at 35° makes 54% of what the same panels make facing south, but a shallow north slope at 10° makes 75%, because at that angle the panels face the sky more than the compass point. Single-storey extensions and garage roofs are often that shallow, so measure one before ruling it out.
From a kWp figure to your roof
kWp is the combined rating of the panels in full sun. Ten panels rated at 430 W each make 4.3 kWp, which on an unshaded south roof at 35° here comes to about 4,103 kWh a year. Who weighs that figure depends on the tenure. Owners set it against the price per kW on the cost page and the steps on owner-occupiers. A landlord looking at a let terrace will find the choices on private renters and landlords, and a housing association tenant can quote these numbers when asking about the landlord’s plans, as housing association tenants suggests.
Using the figures
An MCS-certified firm must give you a performance estimate for your roof (MCS). Compare it with the table: a little below with shading noted is normal, well above needs explaining. Exported units are paid under the SEG, and the roof rules are in the permitted development order. The who-decides tool does the multiplication for your roof.